Wishing everyone a Happy new year in 2023. Before we open a new chapter of new L1/L2 narratives in crypto, let’s revisit how all the different chains have performed so far from the adoption metrics data in 2022.
How many people are using blockchain, how many transactions are they settling, and what is the adoption trend like? who is the winner, and who is fading? What’s happening in each chain, and what are the upcoming catalysts? Let’s explore all this with some hard data.
The 4 fundamental adoption stats I would use is Daily Active Addresses (DAAs), daily transactions, Total Value Locked (TVL), and unique contracts deployed.
DAAs measure how many people are using it, daily transactions measure how active people are using it, TVL measures the demand for dApps (buildings), and unique contracts measure the pace of construction in a city (chain).
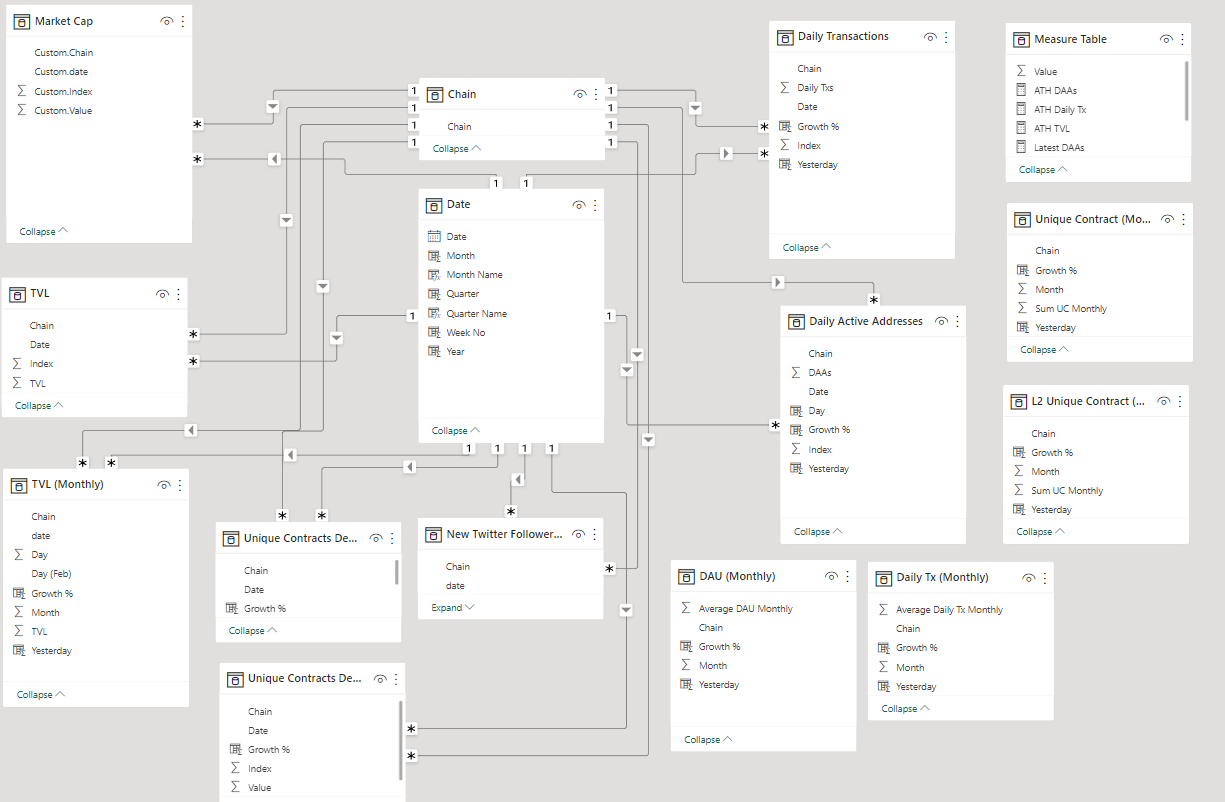
All data is extracted from Goku Stats and cleaned up on Power BI.
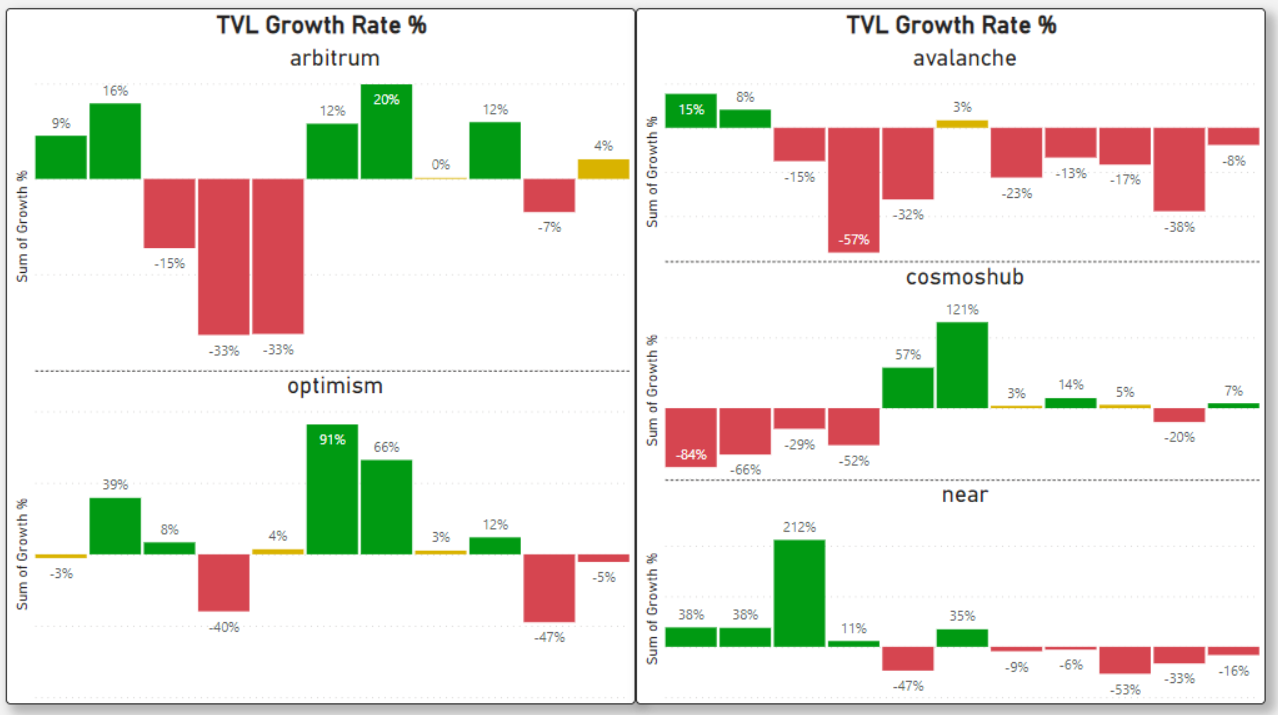
I have also added my calculations of the M-o-M growth rate to visualize the adoption trend at a more granular level.
After analyzing the results, I have decided that it would be more appropriate to group the chains into two clusters, “Leaders” and “Challengers.”
Comparing all the chains under the same category would make it hard to visualize the trends of the newer players due to the sheer difference in size.
Based on the current trend (changes monthly), the leaders' category eligibility is to have,
TVL >= $1b
Daily active addresses >= 200k
Daily transactions >= 1m
The leaders’ categories are Ethereum, BSC, Polygon, and Solana.
The challengers’ categories are Arbitrum, Avalanche, Cosmos, NEAR, and Optimism.
1. Leaders Category
1.1 Average Daily Active Addresses
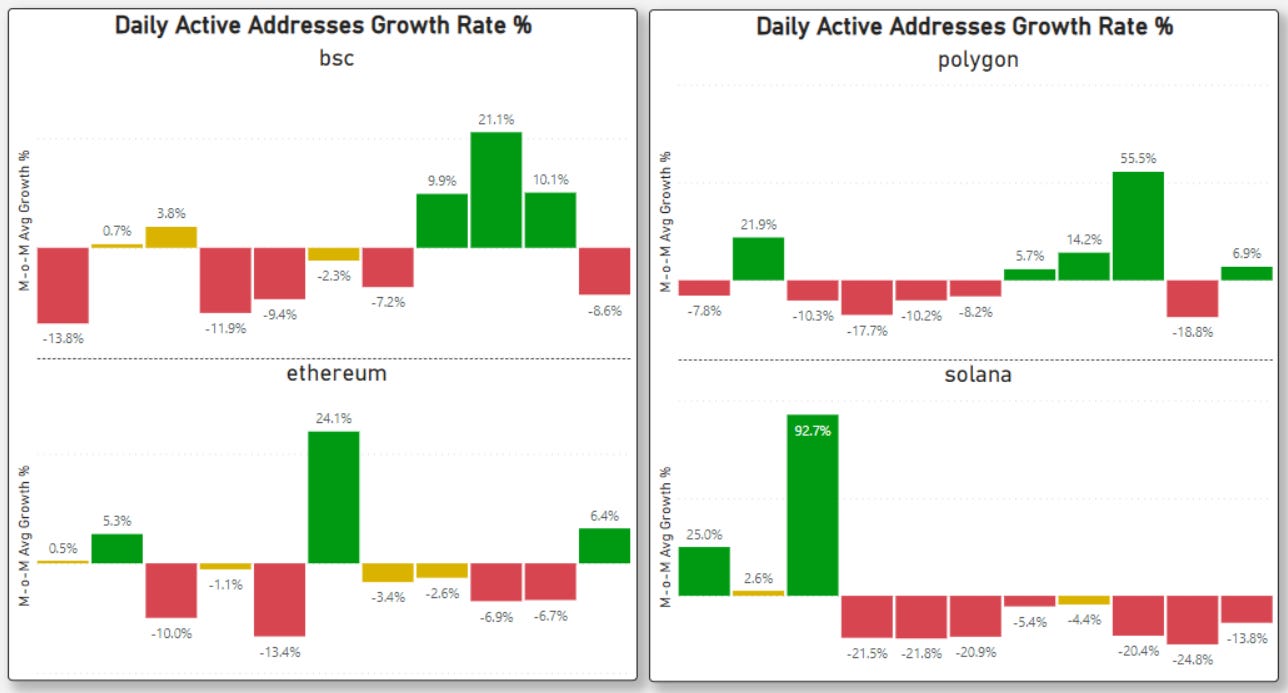
To measure the retention trend of DAAs, I calculated the M-o-M growth rate % of the average daily active addresses.
Any growth rate between -5% to 5% is stable (yellow), below -5% contraction (red), and above 5% expansion (green).
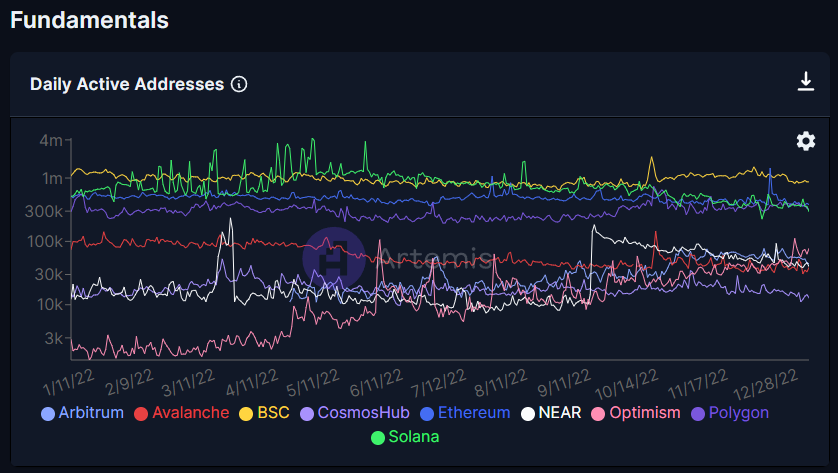
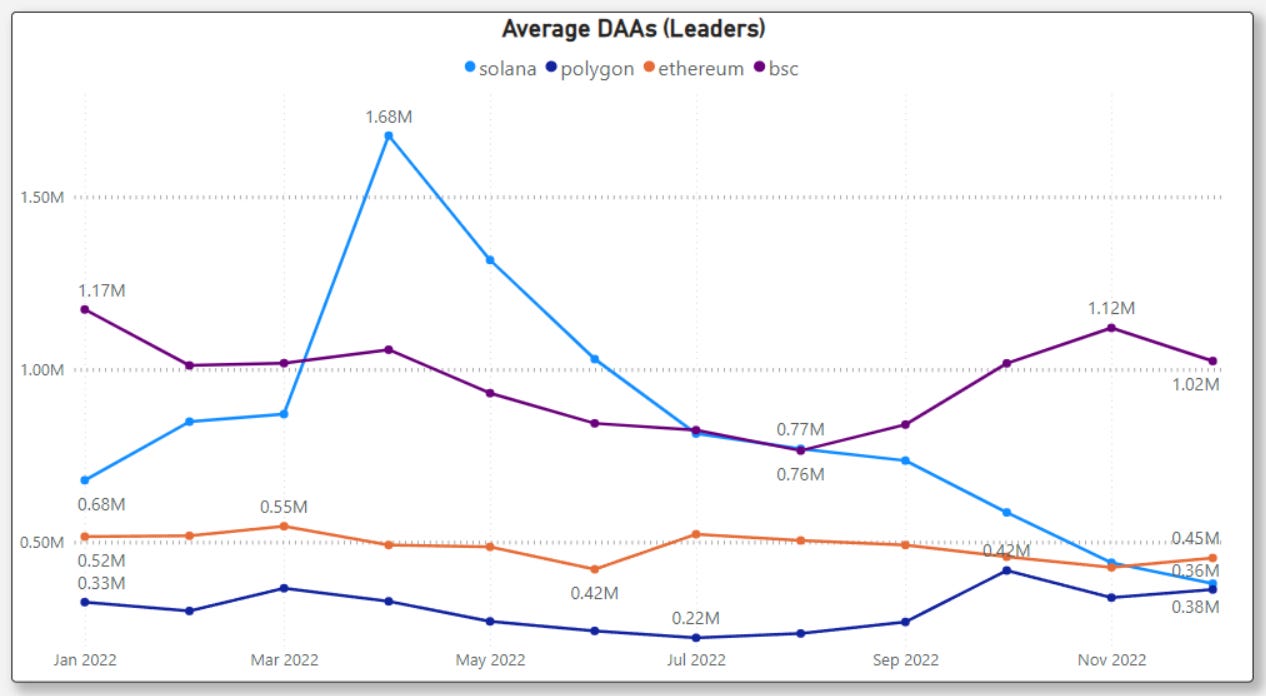
BSC is the only chain with more than a million daily active addresses.
Ethereum DAA is between 400-500k, and Polygon at around 300-400k.
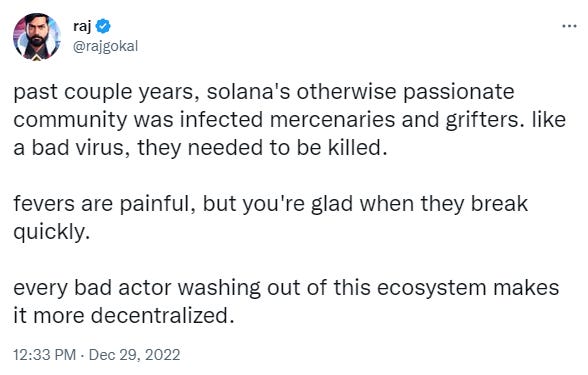
Solana has been underwater, showing negative growth for 8 consecutive months.
Solana’s daily active addresses fell below Ethereum for the 1st time in Dec 2022.
Polygon made a slow, steady recovery since May, with a sudden sharp spike of 55% in October. The spike is likely due to Reddit’s NFT program in October + the successful wave of web2 BD deals they secured.
BSC & Polygon did relatively well in Q3-Q4, capturing back user growth after the initial flush in 1H of 2022.
Relative to BSC & Polygon, Ethereum fared poorly in the 2H of 2022, but its slowdown has been well-contained. None of the months fell below -10%.
1.2 Average Daily Transactions
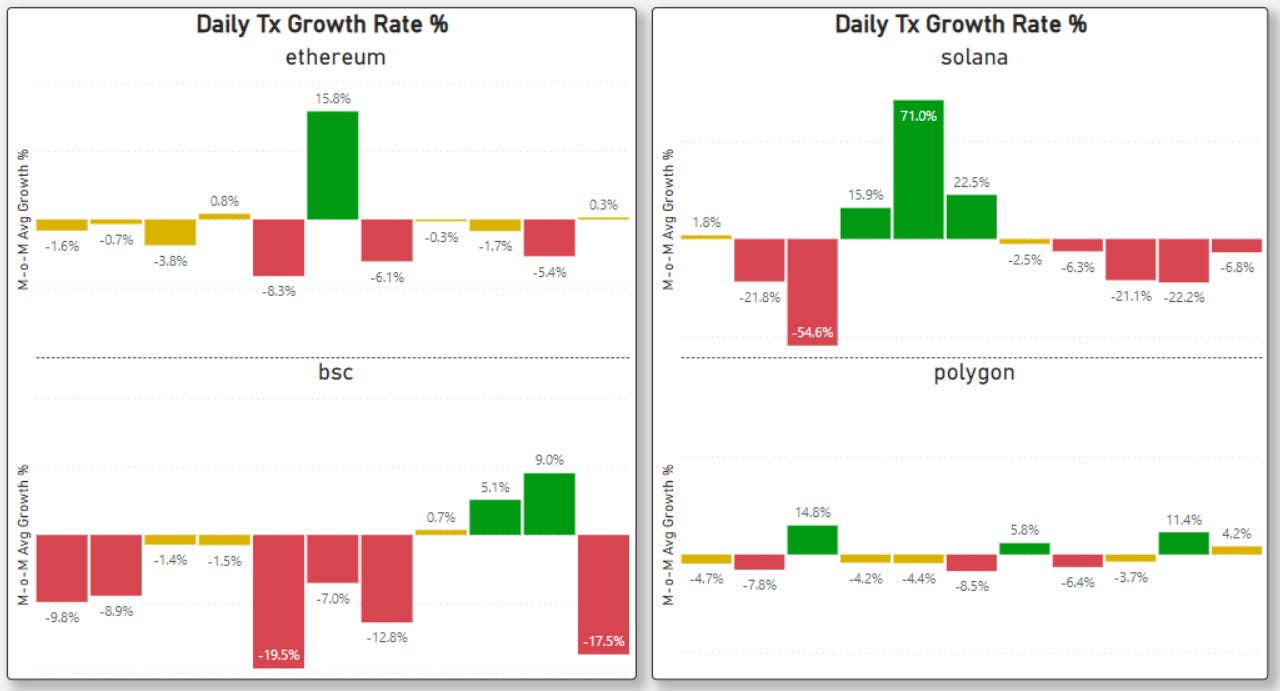
Looking at the M-o-M growth rate for daily transactions,
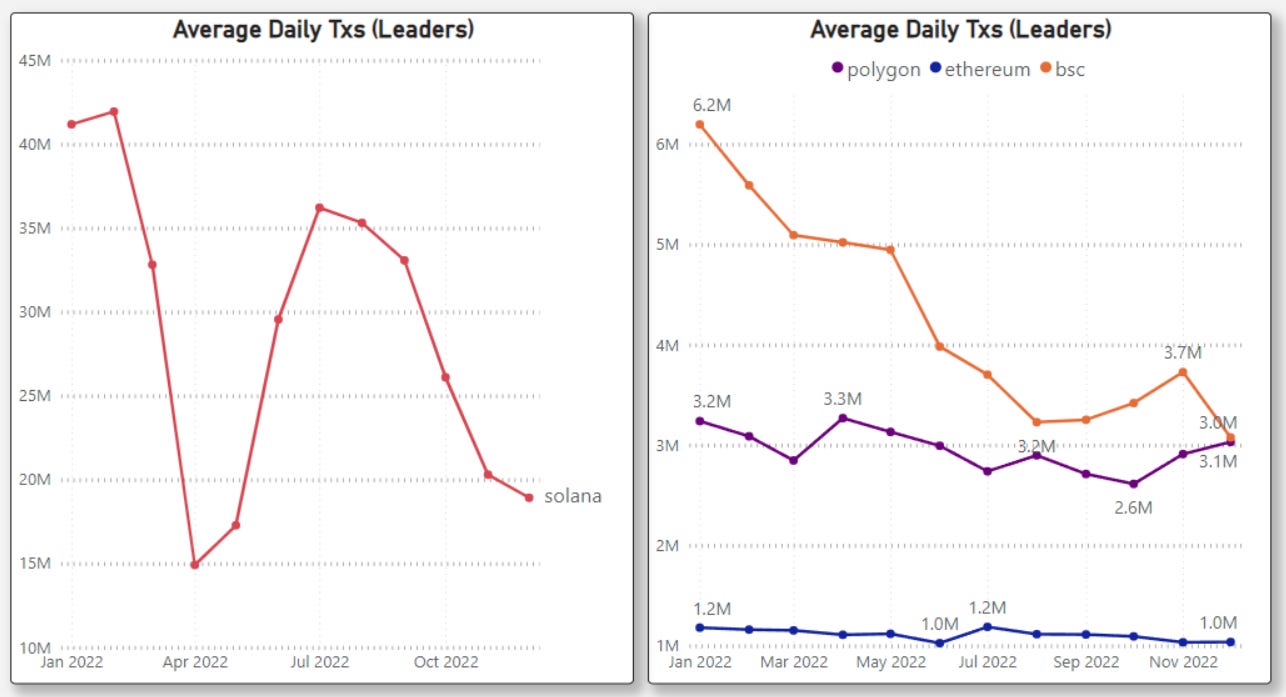
Polygon showed the most stable daily transactions with the least variance.
Polygon is on the verge of flipping BSC daily transactions in Q4 (Both are around 3m~ now).
BSC’s daily tx has been on a consecutive decline for the first 7 months of 2022.
Solana has the highest daily transactions. (excluding vote transactions)
Solana did best in Q2, however daily active addresses contracted in Apr, May June during the same period.
The majority of the spike in transactions comes from unknown contracts.
Ideally, the surge in daily transactions should correlate with the increase in daily active addresses for the growth story to be consistent.
Solana did the worst in Q4 after the collapse of FTX. Following Solana’s capitulation, only 3 out of 107 devs sampled have indicated that they are switching chains.
Ethereum’s daily transactions hovered steadily around 1m in 2022.
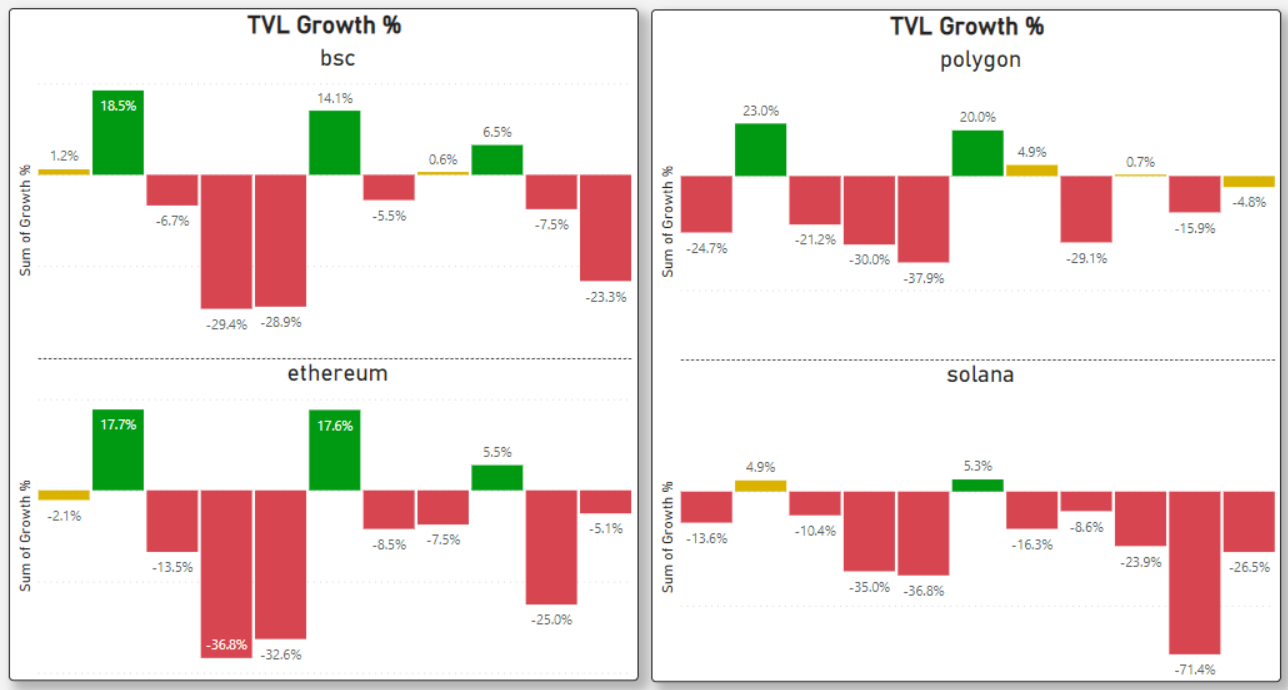
1.3 Total Value Locked (TVL)
In terms of TVL,
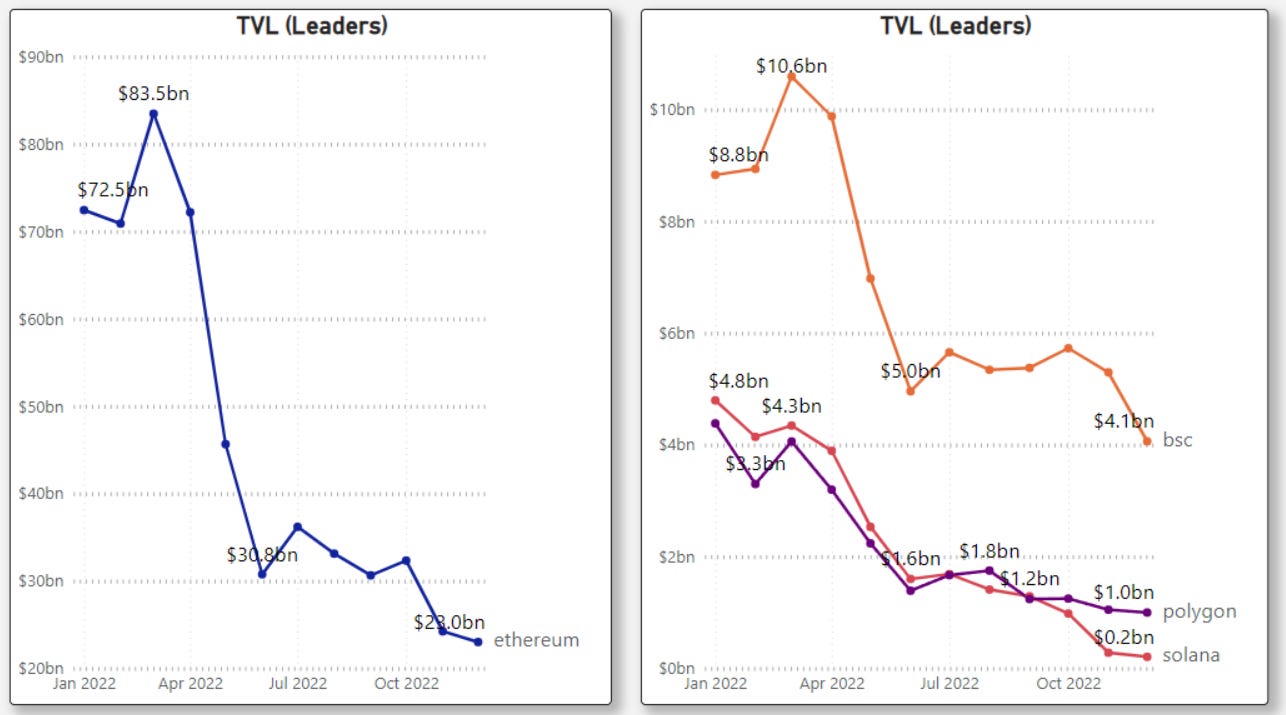
Ethereum is still undisputed in TVL, with about $23b at the end of the year.
As of 2022 Dec, BSC’s TVL is 18% of Ethereum, and Polygon is 4.3% of Ethereum.
Overtaking Ethereum at this point still seems a distant dream for any L1s.
Solana is the first chain in the leader category to fall under $1b TVL, a 96% drop.
During the positive months in Feb and June, Solana’s TVL inflow was 3-4x lower than its competitors. There was no green upshoots >10% for the year 2022.
Everyone was hit hard by Terra’s collapse in May, with the contagion impact lessened in Nov when FTX collapsed. (Except Solana, which worsened)
Every chain’s TVL is correlated, it’s a one-way road down. After the relief rally in June, new TVL inflows for 2H of 2022 remained muted.
Ethereum did not benefit from the “flight-to-safety” thesis in a bear market.
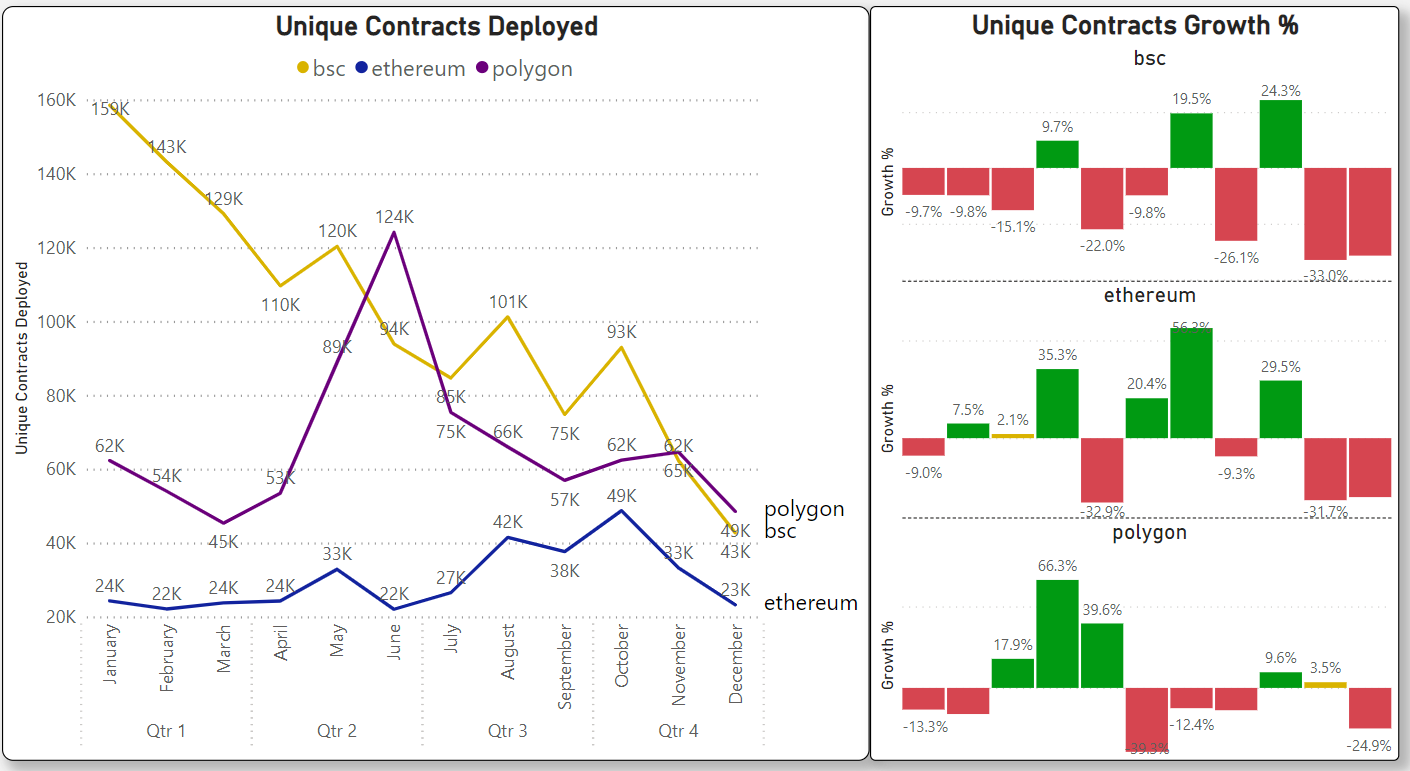
1.4 Unique Contracts Deployed
BSC downtrend of unique contracts deployed is the strongest. 9 out of 12 months is a contraction, and YTD is -70%. Polygon flipped BSC as of Dec 2022.
Ethereum showed slow positive uptrend growth in the first 3 quarters but fell back to where it was originally in Q4. The same trend can be observed with Polygon.
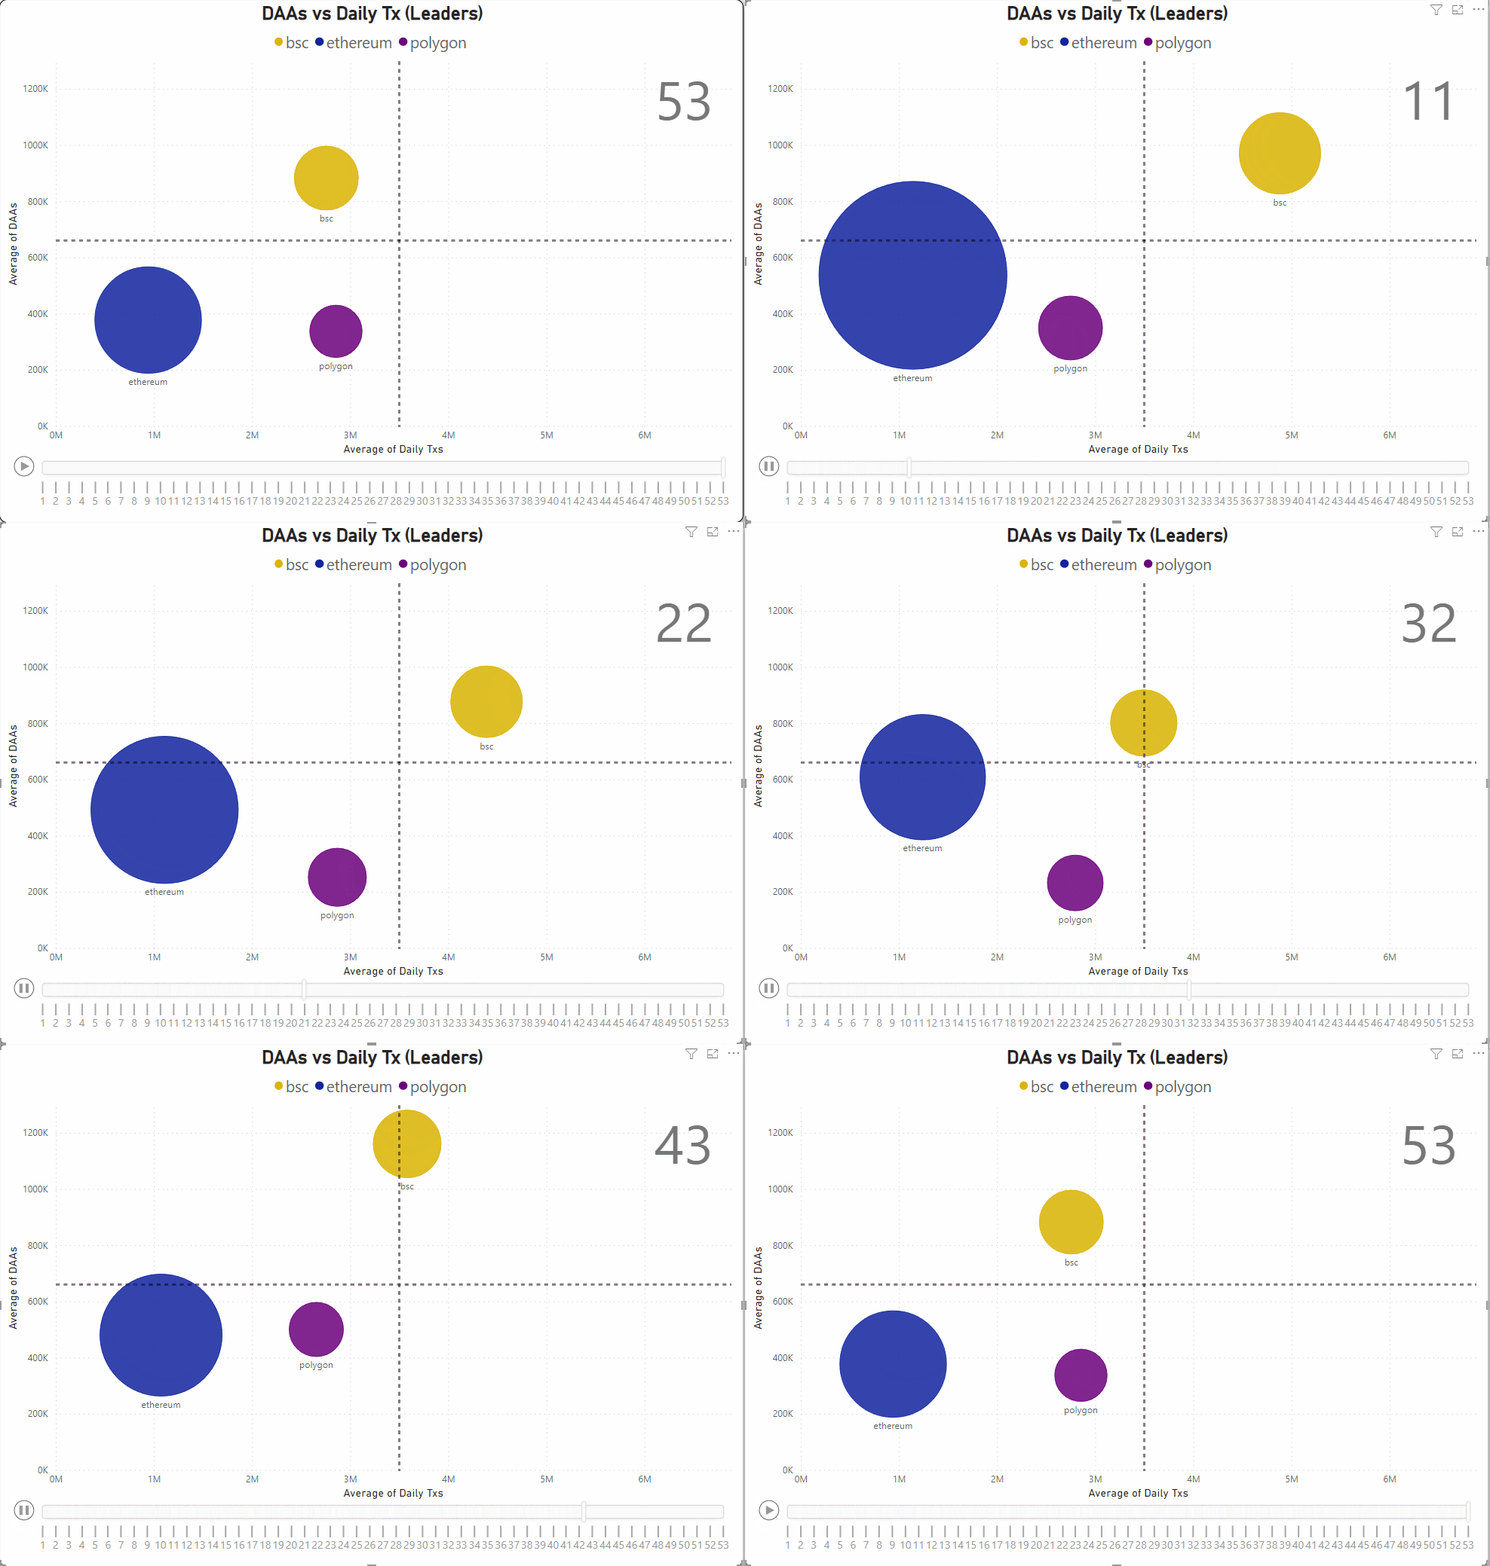
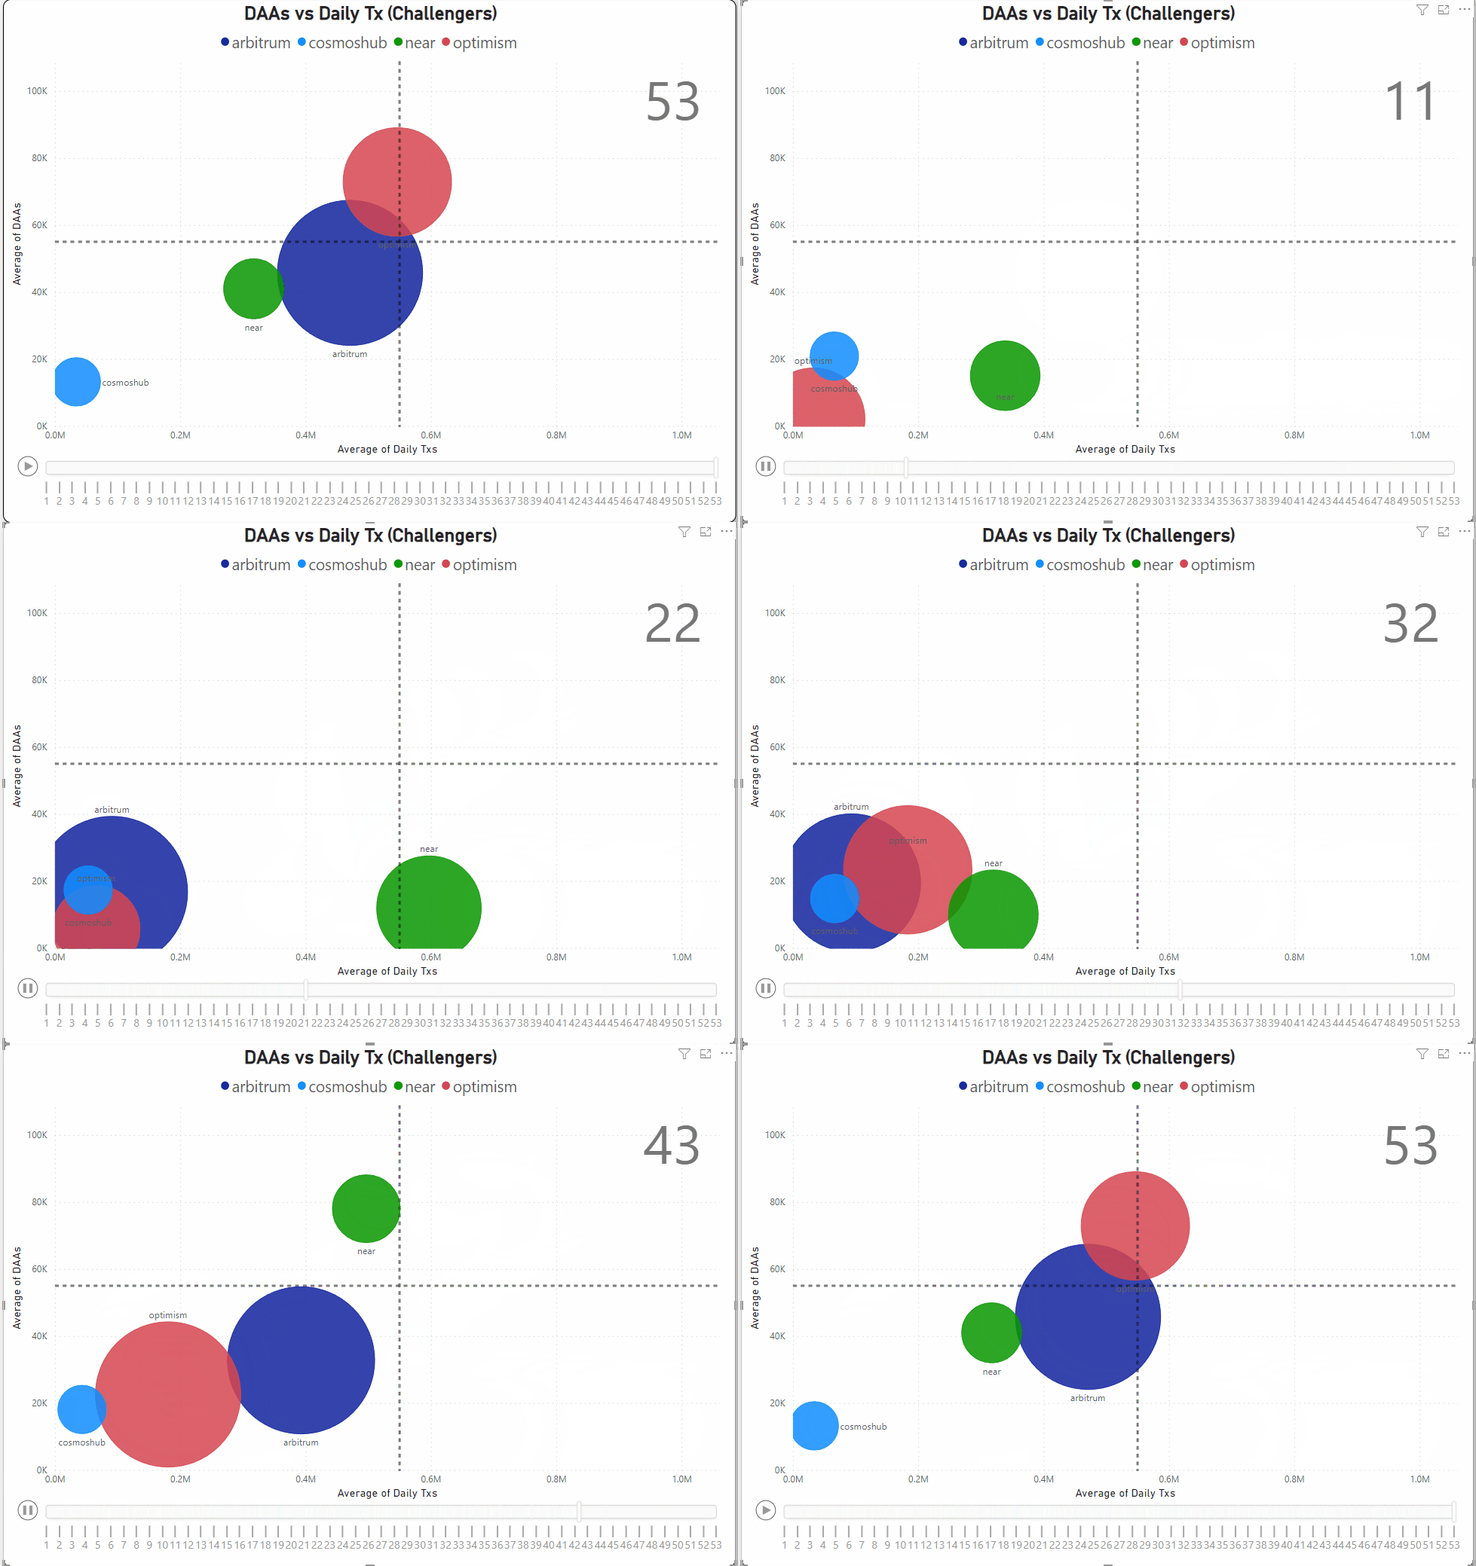
Putting all the metrics together, here’s a scatter chart I created to visualize the real-time weekly change in state for 2022. (Solana has been excluded as its transactions are way too high, also it has been ousted from the leader category after its TVL fell below <$1b.)
The bubble size represents TVL, the y-axis represents average daily active addresses and the x-axis average daily transactions. Ideally, you want to see the bubble getting bigger and moving toward the upper right-hand corner.
To conclude, for the leader category,
Ethereum is the king of TVL.
BSC is the king in activity & velocity.
Polygon is the king of stability, making steady progress.
Solana is the fallen angel by all metrics.
The rate of contraction is slowing in the 2nd half, indicating that the ‘tourists’ have been flushed out. But there are no signs of a positive recovery trend just yet.
2. Challengers Category
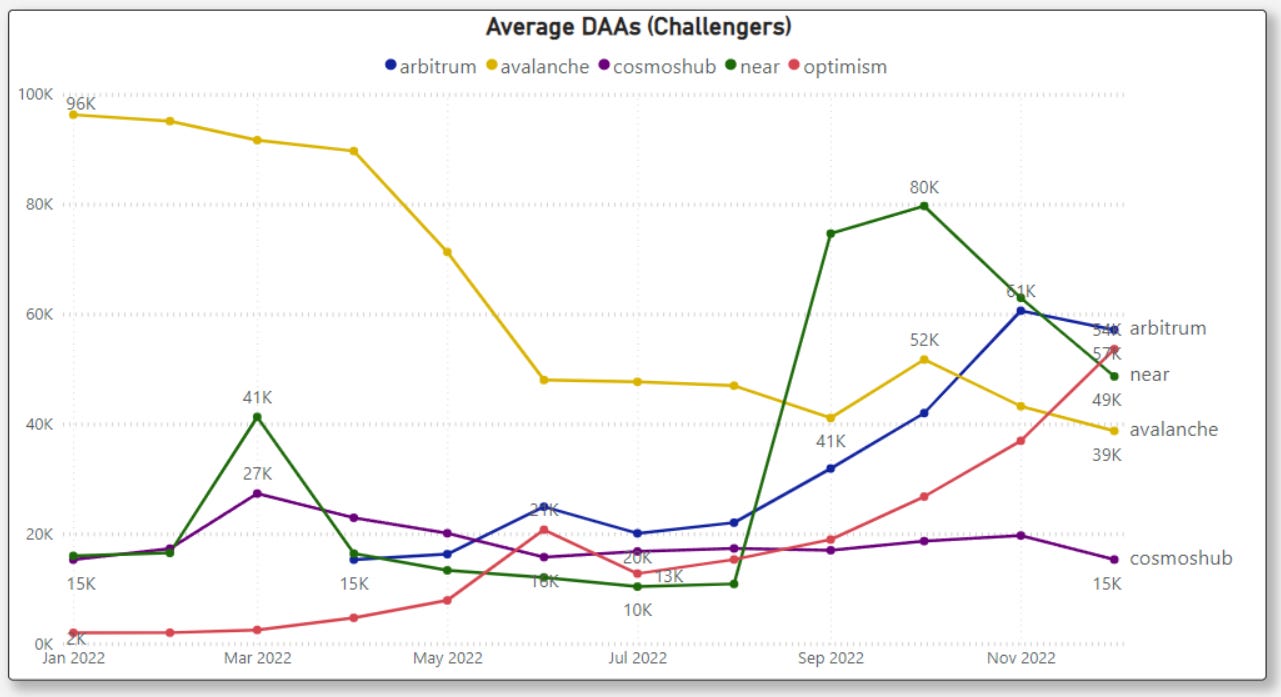
2.1 Average Daily Active Addresses
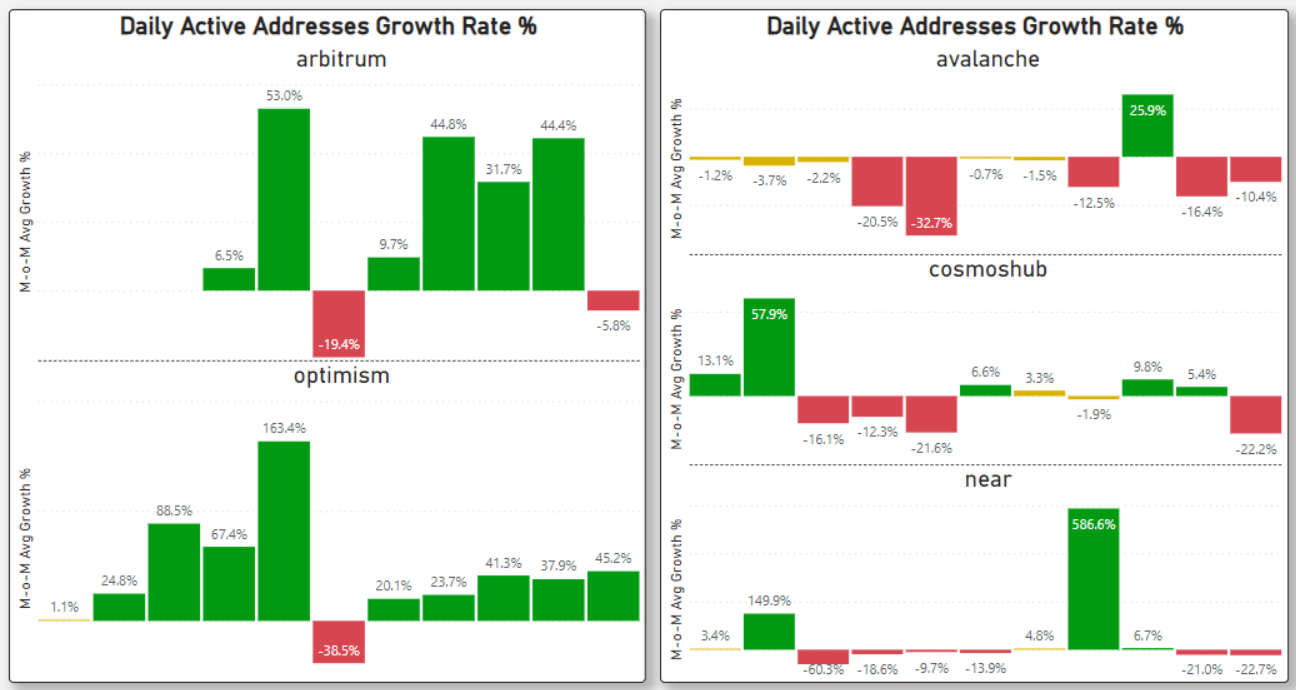
For the M-o-M DAA growth rate,
Arbitrum and Optimism is the high-growth rising star. Average daily active addresses showed strong positive growth. Both are around 50-60k in Dec 2022. (Optimism has the added advantage through its OP token grant incentives)
Optimism announced round 2 of its Retroactive Public Goods Funding in Dec 2022. 10M OP tokens will be distributed on Feb 2023 to users and projects who meet their outlined requirements.
Cosmos remained relatively flat, with little growth across the year 2022. Most of the activities come from CosmosHub, Osmosis, and Evmos.
AVAX daily active addresses have shrunk by more than 50% from Jan. It was reporting neutral to negative growth every month for the year, except Oct when Avalanche launched the Banff Elastic subnet.
Banff unlocks the ability for subnet creators to active proof-of-stake and uptime rewards using their tokens. This allows users to become validators on the subnet by staking the tokens.
NEAR’s Daily active addresses spiked sharply in Sep by 580% but declined in Q4.
NEAR’s spike in DAAs was due to Sweat economy TGE in September. In the same month, NEAR also launch phase 1 of nightshade sharding, allowing ‘chunk-only producer’ validators to produce parts of the shard with lower computational requirements.
2.2 Average Daily Transactions
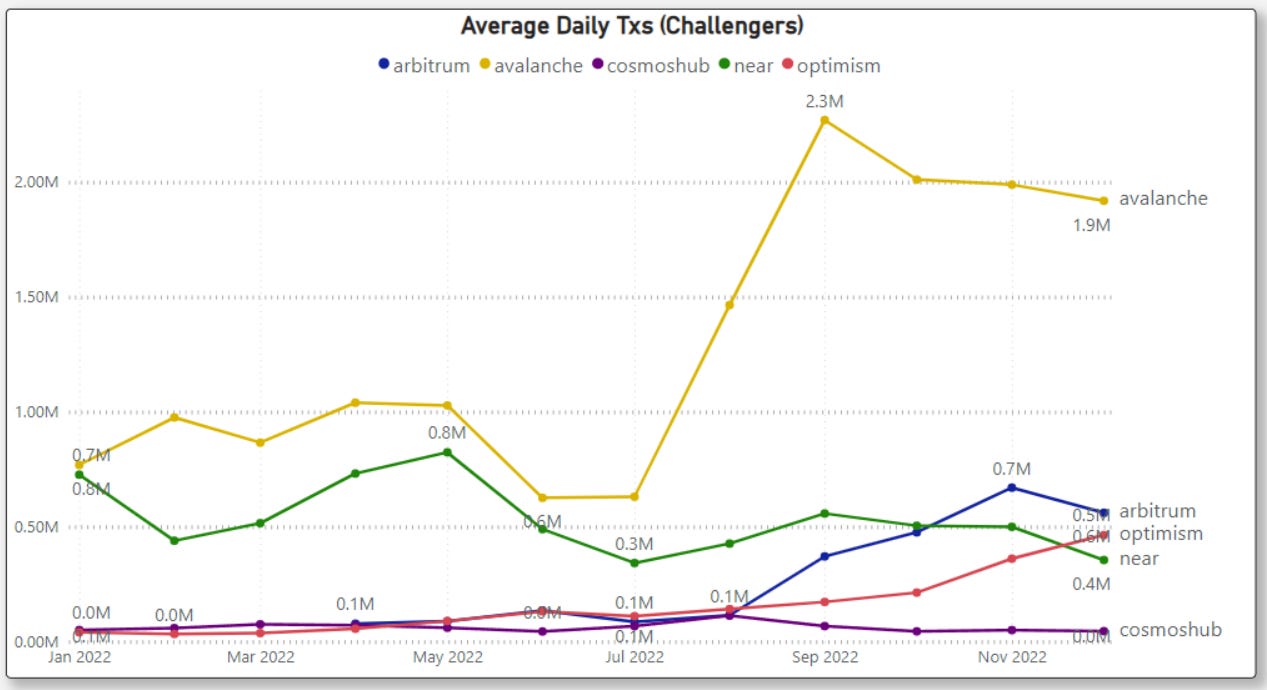
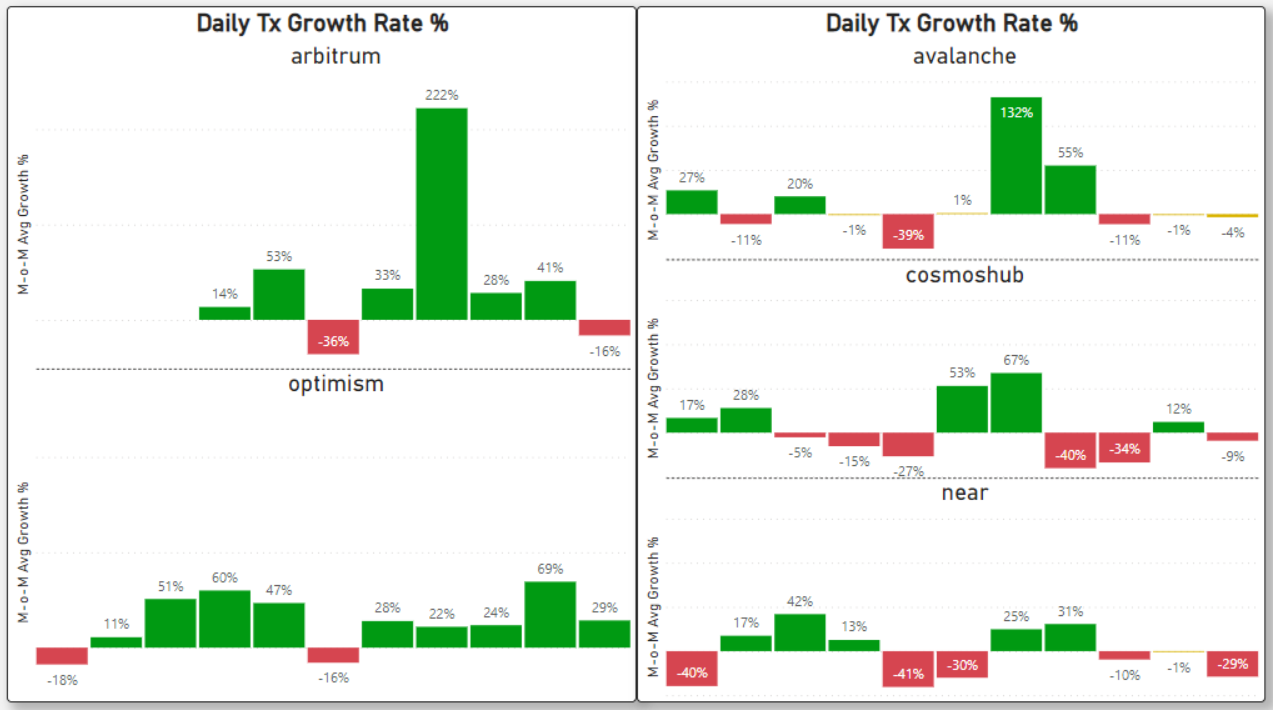
Arbitrum and Optimism showed strong positive growth in daily transactions throughout the year. The Arbitrum spike in Sep was likely attributed to the GMX launch alongside with Nitro upgrade to optimize the chain performance.
Despite AVAX’s DAA contracting, its daily transactions saw a 100% spike in the 2nd half of 2022. It comes from DeFi Kingdoms (DFK) and Crabada (Swimmer Network) migrating to their own subnet.
Though subnets are grouped as total transactions on AVAX, only activities on the Avalanche C-chain generate fees and accrue value to the AVAX token.
For NEAR, despite the steep increase in daily active addresses from Sweat Economy, it doesn’t translate to a growth in daily transactions. Likely because Sweat Wallet has yet to launch many of its on-chain DeFi/NFTs functionalities.
All its contenders have dwarfed Cosmo’s daily transactions.
Cosmos is the project everyone talks about and hypes about, but adoption & traction in all metrics continues to be lackluster, predominantly because it lacks a dominant DeFi / stablecoin ecosystem.
2.3 Total Value Locked (TVL)
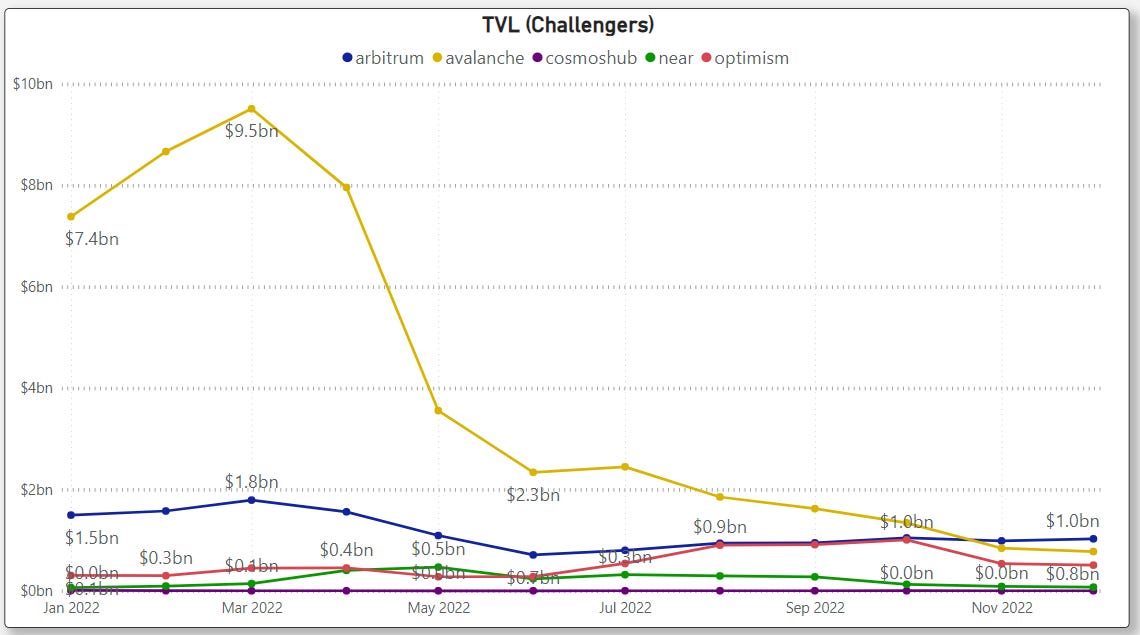
As of Dec 2022, Arbitrum is the only chain in the challenger category with more than $1b TVL.
On the bottom end of the spectrum, NEAR’s TVL is less than $100m, and Cosmo’s TVL is less than $1m. Based on DeFilama, Cosmos’s TVL comes solely from StarFi, a liquid staking dApp.
Cosmos and NEAR were flat for the 2nd half of the year. There were no new notable projects that attracted the attention of fresh TVL deposits.
Arbitrum & Optimism M-o-M TVL growth showed signs of slowing in 2H of 2022.
Optimism’s TVL in Nov plummeted by around 50%.
AVAX used to be strong in TVL ($8-9b~), comparable to the leaders’ category, but it nose-dived from the cliff in March and never recovered since after the 3AC saga. The rest of the year just saw money exiting month after month.
2.4 Unique Contracts Deployed
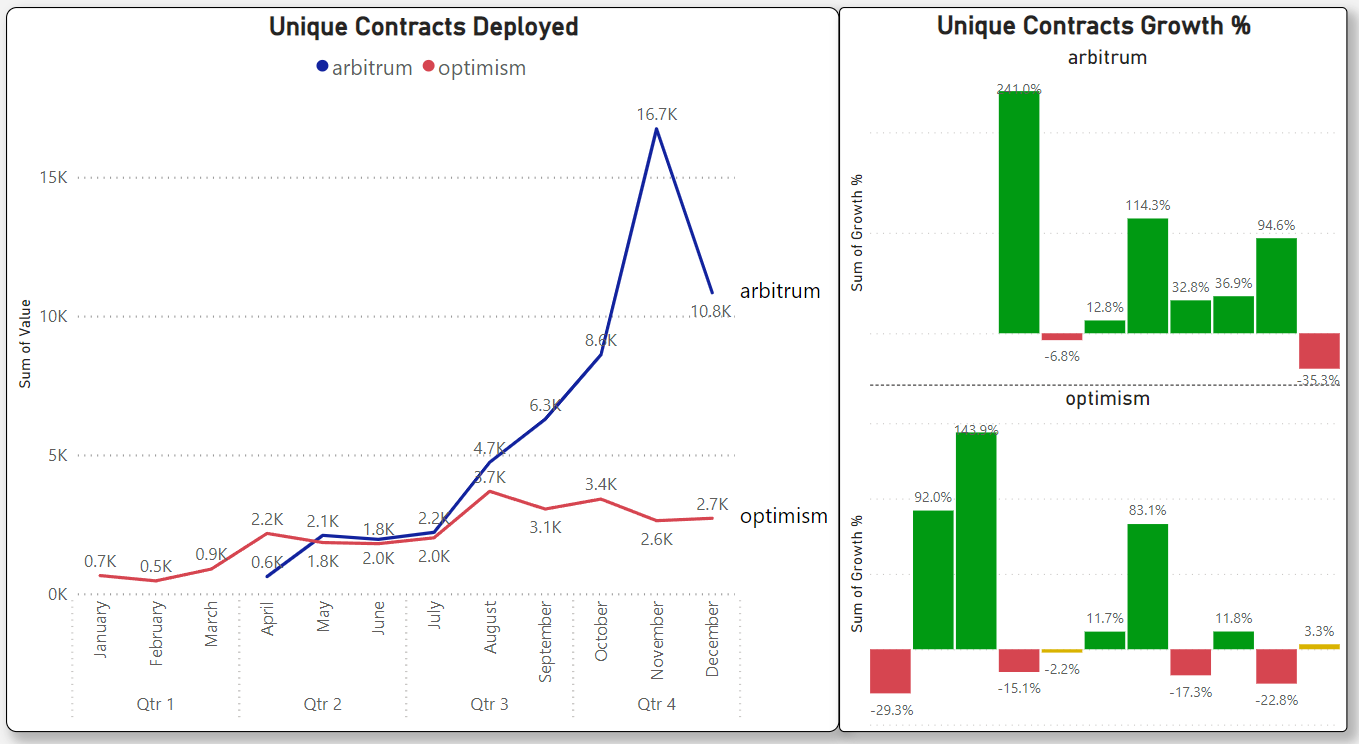
In terms of which city is more popular for developers and dApps, Arbitrum is the clear winner because of the network effects it has.
Most DeFi protocols chose to launch on Arbitrum, including TraderJoe & Gains Network recently. The more dApps are on Arbitrum, the stronger the value of its network effect will be.
To conclude for the challenger section,
Arbitrum is the king of TVL.
Arbitrum & Optimism is the rising star, Optimism is trailing very closely behind.
AVAX is the fallen angel by all metrics.
NEAR and Cosmos are the laggards.
3. Conclusion
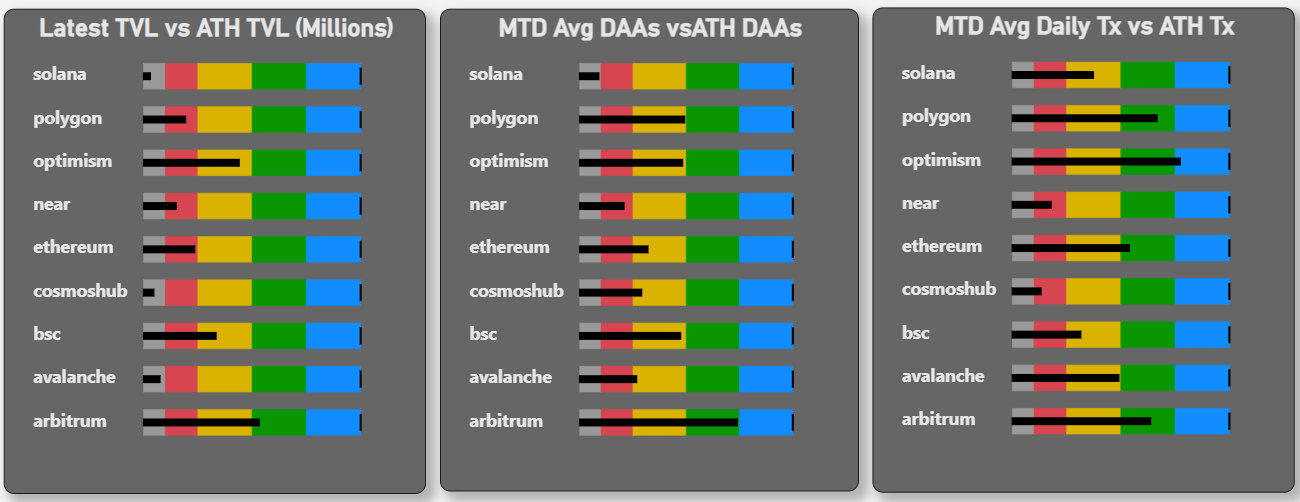
Finally, here is a visual chart showing which chain has fallen the hardest from its ATH in TVL, Daily Active Addresses, and Daily Transactions. This shows the retention and resilience strength of each chain during the bear market.
Anything in the grey area is = >90% drop and is not a healthy sign. Anything in the green or blue zone is considered very strong.
In order of ranking, TVL is the most important metric as it has the highest correlation with market cap, followed by daily active addresses and daily transactions when analyzing chain adoption.
Arbitrum is the only chain that is green in all 3 metrics.
Optimism comes second after Arbitrum, showing relatively healthy performance.
Optimism daily tx spiked in Dec after the 2nd round of OP tokens airdrops.
NEAR, AVAX and Cosmos were hit pretty badly.
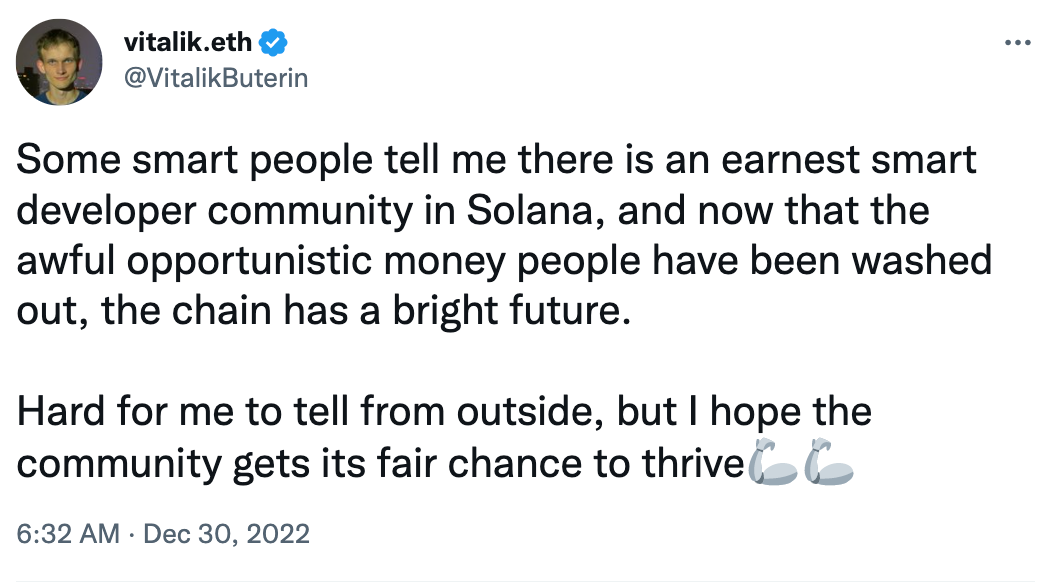
Solana is grey in TVL and DAAs, indicating most players left in 2022.
On the bright side, Solana’s TVL was artificially propped up by The Macalinao brothers. This means its fall was not as bad since the real ATH should be lower.
To conclude, monitoring these adoption trends could provide broad insights into whether the industry is growing, plateauing, or contracting and which chains are growing and which are not.
Moving forward into 2023, here are some key catalysts amongst the chains to keep a lookout for.
3.1 2023 Catalysts
Leaders Category
Ethereum Shanghai Upgrade (ETA as early as March). It will be the next milestone after The Merge. Having withdrawals enabled for staking ETH will increase demand for ETH and attract many more users to stake.
EIP-4844 (proto-danksharding). The first milestone to sharding. EIP-4844 are shard blob transactions, a new kind of transaction type which accepts ‘blobs’ of data to scale the network.
EIP-1559 Ultrasound Money burn narrative. Despite the sluggish markets, there were periods in Oct-Nov where a small surge in activities is enough to activate the ETH burn threshold making ETH deflationary. The heat will likely be turned up when markets show signs of recovery.
Polygon zkEVM testnet updates. Audits are currently ongoing. It is at the final steps of the last testnet before the mainnet.
Solana turnaround. Solana offers a high-risk-reward opportunity. One thing for sure is all the predators have been flushed out, Solana technical team is strong, and the network is highly performant. If outage issues could be resolved, there’s a decent shot for Solana. But banking on turnarounds is often hard, especially when much of the ecosystem has left.
Challengers Category
Avalanche Wrap Messaging in Banff 5 upgrade allows subnets to talk to each other natively. It is currently available in the Golang and Rust VM SDKs but will soon be pushed out to EVM subnets in 2023.
Arbitrum resumption of Odyssey, an NFT program halted earlier due to a spike in gas fees and the launch of the Arbitrum token.
Arbitrum cannibalizing the DeFi ecosystem. Uniswap on Arbitrum is close to flipping Polygon 24hr volume.
GameFi or Social applications built on Avalanche’s subnet or Arbitrum’s Nova.
Cosmos’s Interchain Security is scheduled to be ready by Jan 2023, Circle is introducing native USDC into the ecosystem, and the dYdX app chain launch.
A revamped version of the Cosmos 2.0 whitepaper gets proposed.
Optimism migrating Goerli Testnet to Bedrock on January 12, 2023. And Mainnet is expected to move to Bedrock by Q1 if everything runs smoothly. Bedrock improvements lower L1 data fees and introduce new proof mechanisms.
Optimism’s sole carry, Synthetix, to push adoption stats up after its v3 launch.
There are probably many more catalysts that I might have missed out on.
The challenger category is going to get even more crowded and highly contested in 2023 with the new emerging contenders like Sui, Aptos, Sei, Bera chain, Celestial, Oasys, Myria, IMX, subnets, app chains, Starkware, zkSync, Eclipse/Neon/Nitro on Solana and many more. (Plus Fantom & Polkadot, which is not available on GokuStats)
It will be an exciting year as we see who will make it into the new leader category and who will fall behind. As the data gets richer, I will make more regular updates on the dashboards.


